Three.js 概率统计可视化
提示词
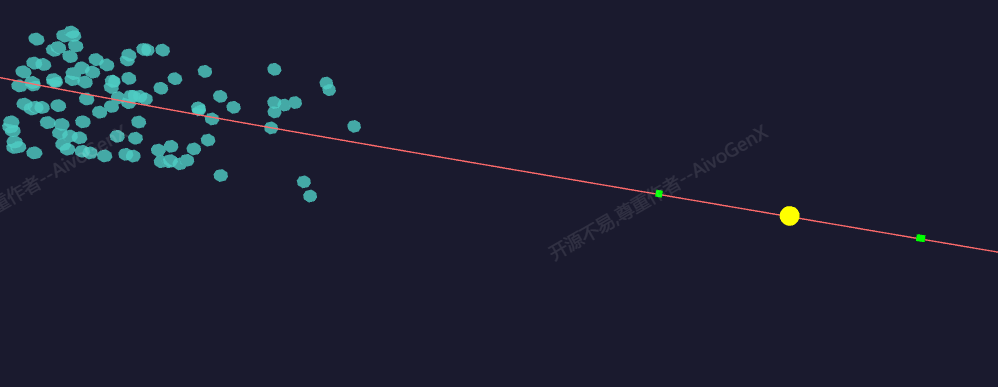
使用 Three.js 创建概率统计可视化,展示三维图表的概率分布特性。
效果描述
这是一个展示如何创建概率统计可视化的示例,展示三维图表的概率分布特性。
效果特性
- 概率分布:展示概率分布
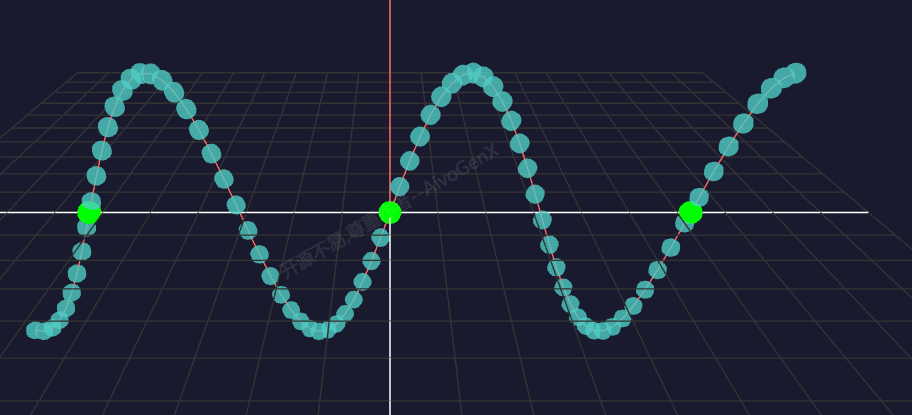
- 正态分布:实现正态分布
- 均匀分布:实现均匀分布
- 统计量显示:显示统计量
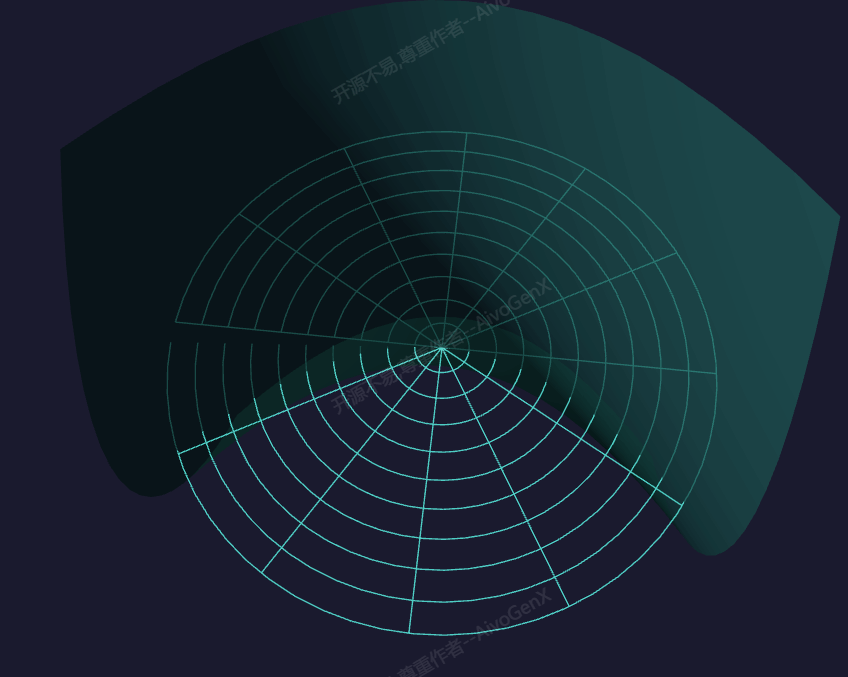
- 三维图表:三维图表展示
- 参数调整:调整分布参数
核心参数
| 参数 |
值 |
说明 |
| 分布类型 |
正态分布 |
分布类型 |
| 均值 |
0.0 |
分布均值 |
| 标准差 |
1.0 |
分布标准差 |
| 样本数量 |
1000 |
样本数量 |
核心代码解析
创建分布图表
1
2
3
4
5
6
7
8
9
10
11
12
13
14
15
16
17
18
19
20
21
22
23
24
25
26
27
28
29
30
31
32
33
34
35
36
37
38
39
40
41
42
43
44
45
46
function createDistributionChart() {
    const params = {
        distribution: 'normal',
        mean: 0.0,
        stdDev: 1.0,
        sampleSize: 1000
    };

    const group = new THREE.Group();

    const samples = generateSamples(params);
    const histogram = createHistogram(samples);
    group.add(histogram);

    const curve = createDistributionCurve(params);
    group.add(curve);

    return group;
}

function generateSamples(params) {
    const samples = [];

    switch(params.distribution) {
        case 'normal':
            for(let i = 0; i < params.sampleSize; i++) {
                samples.push(generateNormalRandom(params.mean, params.stdDev));
            }
            break;
        case 'uniform':
            for(let i = 0; i < params.sampleSize; i++) {
                samples.push(Math.random() * 2 * params.stdDev + params.mean - params.stdDev);
            }
            break;
    }

    return samples;
}

function generateNormalRandom(mean, stdDev) {
    let u = 0, v = 0;
    while(u === 0) u = Math.random();
    while(v === 0) v = Math.random();

    return Math.sqrt(-2.0 * Math.log(u)) * Math.cos(2.0 * Math.PI * v) * stdDev + mean;
}
创建直方图
1
2
3
4
5
6
7
8
9
10
11
12
13
14
15
16
17
18
19
20
21
22
23
24
25
26
27
28
29
30
31
32
33
34
35
36
37
38
39
40
41
function createHistogram(samples) {
    const bins = 50;
    const min = Math.min(...samples);
    const max = Math.max(...samples);
    const binWidth = (max - min) / bins;

    const histogram = new Float32Array(bins);

    samples.forEach(sample => {
        const binIndex = Math.floor((sample - min) / binWidth);
        if(binIndex >= 0 && binIndex < bins) {
            histogram[binIndex]++;
        }
    });

    const maxCount = Math.max(...histogram);
    const geometry = new THREE.BufferGeometry();
    const positions = [];
    const colors = [];

    for(let i = 0; i < bins; i++) {
        const x = min + i * binWidth + binWidth / 2;
        const height = (histogram[i] / maxCount) * 5;
        const color = new THREE.Color().setHSL(i / bins, 0.8, 0.5);

        positions.push(x, 0, 0);
        positions.push(x, height, 0);
        positions.push(x + binWidth, height, 0);
        positions.push(x + binWidth, 0, 0);

        for(let j = 0; j < 4; j++) {
            colors.push(color.r, color.g, color.b);
        }
    }

    geometry.setAttribute('position', new THREE.Float32BufferAttribute(positions, 3));
    geometry.setAttribute('color', new THREE.Float32BufferAttribute(colors, 3));

    const material = new THREE.LineBasicMaterial({ vertexColors: true });
    return new THREE.LineSegments(geometry, material);
}
技术亮点
- 概率分布:展示概率分布
- 正态分布:实现正态分布
- 均匀分布:实现均匀分布
- 统计量显示:显示统计量
- 三维图表:三维图表展示
调试技巧
- 分布类型:调整分布类型观察不同分布
- 均值参数:调整均值参数改变分布位置
- 标准差参数:调整标准差参数改变分布宽度
- 样本数量:调整样本数量测试性能
- 直方图参数:调整直方图参数改变显示
扩展方向
- 更多分布:添加更多分布类型
- 统计指标:添加更多统计指标
- 动画效果:添加动画效果
- 交互控制:添加交互控制
- 比较分析:支持分布比较
本文档由 ThreeLab 编辑整理,如需转载,请注明出处。


💬 评论区
评论功能即将上线,敬请期待!