


📷 坐标系和函数图像
Three.js 坐标系和函数图像
提示词
PROMPT
1
使用 Three.js 创建坐标系和函数图像,展示三维坐标系中的函数图像。
效果描述
这是一个展示如何创建坐标系和函数图像的示例,展示三维坐标系中的函数图像。
效果特性
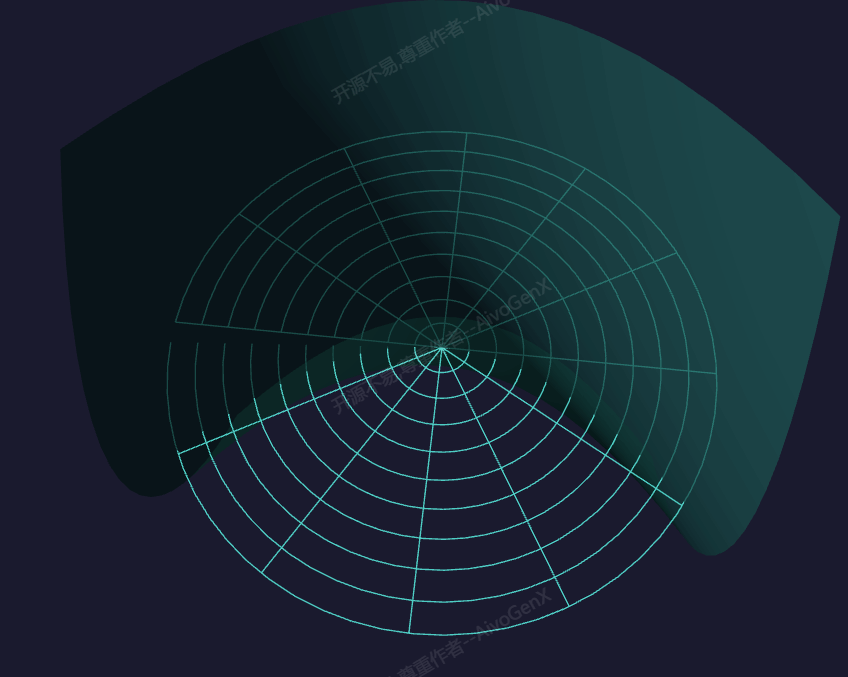
- 坐标系显示:显示坐标系
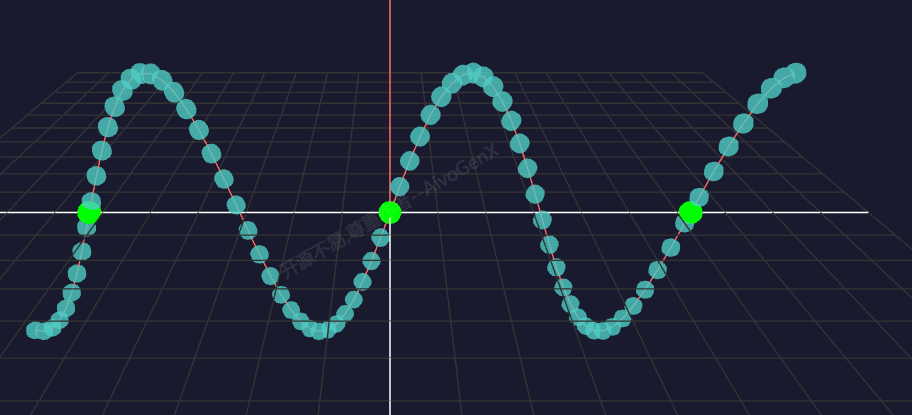
- 函数图像:展示函数图像
- 笛卡尔坐标系:实现笛卡尔坐标系
- 柱面坐标系:实现柱面坐标系
- 球面坐标系:实现球面坐标系
- 网格显示:显示坐标网格
核心参数
| 参数 | 值 | 说明 |
|---|---|---|
| 坐标系类型 | 笛卡尔坐标系 | 坐标系类型 |
| 函数类型 | 二元函数 | 函数类型 |
| 参数a | 1.0 | 函数参数a |
| 参数b | 1.0 | 函数参数b |
核心代码解析
创建坐标系
JAVASCRIPT
1
2
3
4
5
6
7
8
9
10
11
12
13
14
15
16
17
18
19
20
21
22
23
24
25
26
27
28
29
30
31
32
33
34
35
36
37
38
39
40
function createCoordinateSystem() {
    const params = {
        coordinateType: 'cartesian',
        showGrid: true,
        showLabels: true
    };

    const group = new THREE.Group();

    const axisLength = 10;
    const axisMaterial = new THREE.LineBasicMaterial({ color: 0xffffff });

    const xAxisGeometry = new THREE.BufferGeometry().setFromPoints([
        new THREE.Vector3(-axisLength, 0, 0),
        new THREE.Vector3(axisLength, 0, 0)
    ]);
    const xAxis = new THREE.Line(xAxisGeometry, axisMaterial);
    group.add(xAxis);

    const yAxisGeometry = new THREE.BufferGeometry().setFromPoints([
        new THREE.Vector3(0, -axisLength, 0),
        new THREE.Vector3(0, axisLength, 0)
    ]);
    const yAxis = new THREE.Line(yAxisGeometry, axisMaterial);
    group.add(yAxis);

    const zAxisGeometry = new THREE.BufferGeometry().setFromPoints([
        new THREE.Vector3(0, 0, -axisLength),
        new THREE.Vector3(0, 0, axisLength)
    ]);
    const zAxis = new THREE.Line(zAxisGeometry, axisMaterial);
    group.add(zAxis);

    if(params.showGrid) {
        const gridHelper = new THREE.GridHelper(20, 20, 0x444444, 0x222222);
        group.add(gridHelper);
    }

    return group;
}
创建函数图像
JAVASCRIPT
1
2
3
4
5
6
7
8
9
10
11
12
13
14
15
16
17
18
19
20
21
22
23
24
25
26
27
28
29
30
31
32
33
34
35
36
37
38
39
40
41
42
43
44
45
46
47
48
49
50
51
52
53
54
55
56
57
58
59
60
61
62
63
64
65
66
67
68
69
function createFunctionSurface() {
    const params = {
        functionType: 'paraboloid',
        a: 1.0,
        b: 1.0
    };

    const geometry = new THREE.BufferGeometry();
    const positions = [];
    const colors = [];

    const range = 5;
    const segments = 50;

    for(let i = 0; i <= segments; i++) {
        for(let j = 0; j <= segments; j++) {
            const x = (i / segments) * 2 * range - range;
            const y = (j / segments) * 2 * range - range;
            const z = calculateFunction(x, y, params);

            positions.push(x, y, z);

            const color = new THREE.Color().setHSL((z + range) / (2 * range), 0.8, 0.5);
            colors.push(color.r, color.g, color.b);
        }
    }

    const indices = [];
    for(let i = 0; i < segments; i++) {
        for(let j = 0; j < segments; j++) {
            const a = i * (segments + 1) + j;
            const b = a + 1;
            const c = a + segments + 1;
            const d = c + 1;

            indices.push(a, b, d);
            indices.push(a, d, c);
        }
    }

    geometry.setAttribute('position', new THREE.Float32BufferAttribute(positions, 3));
    geometry.setAttribute('color', new THREE.Float32BufferAttribute(colors, 3));
    geometry.setIndex(indices);
    geometry.computeVertexNormals();

    const material = new THREE.MeshStandardMaterial({
        vertexColors: true,
        side: THREE.DoubleSide,
        metalness: 0.3,
        roughness: 0.7
    });

    return new THREE.Mesh(geometry, material);
}

function calculateFunction(x, y, params) {
    switch(params.functionType) {
        case 'paraboloid':
            return params.a * x * x + params.b * y * y;
        case 'hyperboloid':
            return params.a * x * x - params.b * y * y;
        case 'sine':
            return params.a * Math.sin(x) * Math.cos(y);
        case 'gaussian':
            return -params.a * Math.exp(-(x * x + y * y) / params.b);
        default:
            return 0;
    }
}
技术亮点
- 坐标系显示:显示坐标系
- 函数图像:展示函数图像
- 笛卡尔坐标系:实现笛卡尔坐标系
- 柱面坐标系:实现柱面坐标系
- 球面坐标系:实现球面坐标系
调试技巧
- 坐标系类型:调整坐标系类型观察不同坐标系
- 函数类型:调整函数类型观察不同函数
- 参数a:调整参数a改变函数形状
- 参数b:调整参数b改变函数形状
- 网格显示:调整网格显示观察坐标网格
扩展方向
- 更多坐标系:添加更多坐标系类型
- 更多函数:添加更多函数类型
- 动画效果:添加动画效果
- 交互控制:添加交互控制
- 函数比较:支持函数比较
本文档由 ThreeLab 编辑整理,如需转载,请注明出处。

💬 评论区
评论功能即将上线,敬请期待!